Thursday, October 11, 2012

Another VC compiler optimization bug:(

Last week, my leader had another annoying problem, a snippet like below is not working at all. The GetBool function will assign the 2nd argument “value” to true internally, while when returning, it is still false.

   1: IMyNameValues src;
   2:  
   3: ...
   4:  
   5: if (destField == nullptr)
   6: {
   7:     bool value;
   8:     System::String^ key = strConverter.Utf8ToString(srcField.Name);
   9:     mGuts->CheckCode(src.GetBool(srcField.Name, value));
  10:     dest->AddField(key, value);
  11: }
  12: else if (destField->Type->DotNetType->Equals(System::Boolean::typeid))
  13: {
  14:     bool value;
  15:     const char* pName = srcField.Name;
  16:     mGuts->CheckCode((long)src.GetBool(srcField.Name, value));
  17:     dest->AddField(destField, value);
  18: }
  19:  
  20: ...
  21:  
  22: //the GetBool function's signature is like:
  23: long GetBool(const string& name, bool& value);

After debugging the codes, and found an interesting thing, the “&value” before entering the GetBool function is different from the one inside the function. Then, reading the disassembly code, and manually calculating the local variable address on the call stack (ebp + xxxx), it is really different from the actual address of the local variable.


Then, if I changed the name of the local variable “value”, making different for the if/else branches, and it works!


   1: if (destField == nullptr)
   2: {
   3:     bool value;
   4:     System::String^ key = strConverter.Utf8ToString(srcField.Name);
   5:     mGuts->CheckCode(src.GetBool(srcField.Name, value));
   6:     dest->AddField(key, value);
   7: }
   8: else if (destField->Type->DotNetType->Equals(System::Boolean::typeid))
   9: {
  10:     bool value1;
  11:     const char* pName = srcField.Name;
  12:     mGuts->CheckCode((long)src.GetBool(srcField.Name, value1));
  13:     dest->AddField(destField, value1);
  14: }

And if disabling compiler optimization, also fine. It seems to be a compiler optimization bug, And I tried to reproduce it with some sample small snippet, could not reproduce. Since the product codes are kind of over-designed, introducing too many unnecessary concepts, for instance, virtual inheritance, RTTI, CLI, and etc, also involving a bunch of mangled classes. I had no time to trim them to get a simple case.


Another simple solution is move the inner local variable forward, it also works, e.g.:


   1: bool value;
   2: if (destField == nullptr)
   3: {
   4:     System::String^ key = strConverter.Utf8ToString(srcField.Name);
   5:     mGuts->CheckCode(src.GetBool(srcField.Name, value));
   6:     dest->AddField(key, value);
   7: }
   8: else if (destField->Type->DotNetType->Equals(System::Boolean::typeid))
   9: {
  10:     const char* pName = srcField.Name;
  11:     mGuts->CheckCode((long)src.GetBool(srcField.Name, value));
  12:     dest->AddField(destField, value);
  13: }
Thursday, September 20, 2012

Refer to .net assemblies from vc9/.net 3.5 apps

Our partner gave us some components built with .net 4.0, and our hosting application is mixed application based on 3.5, when trying to refer to them, the compiler complains with errors. Finally figure out how to make it work.

After inserting the reference, unload the project, manually adding the

   1: <ProjectReference Include="XXXX.csproj">
   2:       <Project>{2897acf2-f168-4c4b-8a4e-b1dedd8733fc}</Project>
   3:       <SpecificVersion>true</SpecificVersion>
   4: </ProjectReference>

<SpecificVersion> node also applies to the assembly reference.


Then force the app to load .net 4.0 during the runtime:


   1: <startup useLegacyV2RuntimeActivationPolicy="true">
   2:     <supportedRuntime version="v4.0"/>
   3: </startup>

If using visual studio 2010 to build vc9/3.5 c++ apps, change the target to vc9,


then manually change the target framework to 3.5:


   1: <PropertyGroup Label="Globals">
   2:     <ProjectGuid>{0D090EBF-7467-4DA5-8AE4-E6A52335F0AA}</ProjectGuid>
   3:     <TargetFrameworkVersion>v3.5</TargetFrameworkVersion>
   4:     <Keyword>ManagedCProj</Keyword>
   5:     <RootNamespace>xxxx</RootNamespace>
   6: </PropertyGroup>

Tuesday, September 11, 2012

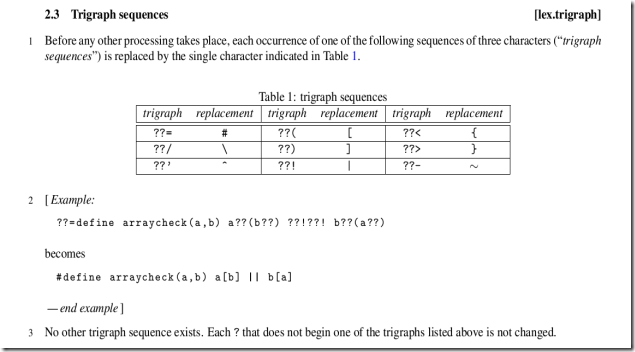
Trigraph in C literal string

Last week, one of my colleague asked me one question, the c++ codes like:

char *p = "??--AB";

will be translated to “~-AB” automatically by the compiler.

After checking the standard reference document, found

image

Really an interesting point for old C codesSmile

The wiki says:

History

The basic character set of the C programming language is a subset of the ASCII character set that includes nine characters which lie outside the ISO 646 invariant character set. This can pose a problem for writing source code when the keyboard being used does not support any of these nine characters. The ANSI C committee invented trigraphs as a way of entering source code using keyboards that support any version of the ISO 646 character set.

[edit]Implementations

Trigraphs are not commonly encountered outside compiler test suites.[1] Some compilers support an option to turn recognition of trigraphs off, or disable trigraphs by default and require an option to turn them on. Some can issue warnings when they encounter trigraphs in source files. Borland supplied a separate program, the trigraph preprocessor, to be used only when trigraph processing is desired (the rationale was to maximise speed of compilation).

Wednesday, August 29, 2012

unittest problems for c++/cli via nunit in VS2008

Recently, my colleagues have some problems of running/debugging c++/cli nunit unittest in VS2008 via TestDriven and Resharper.

For TestDriven, dependent assemblies could not be loaded. For Resharper, VS2010 is fine, under VS2008, running testcases is ok, debugging them gets the error of 89710016 and the hosting process is not even started. After investigation, now find reasons and solutions.

Solutions:
1: Install testdriven.net, whose latest stable version is 3.0, then copy all dlls under
C:\Program Files (x86)\TestDriven.NET 3\NUnit\2.5\lib
to the upper folder. It seems to be testdriven.net’s privatePath setting problem.

2: Install resharper, open regeditor, goes to
HKEY_LOCAL_MACHINE\SOFTWARE\Wow6432Node\Microsoft\VisualStudio\9.0\AD7Metrics\Engine\{449EC4CC-30D2-4032-9256-EE18EB41B62B}
add a string entry:
CLRVersionForDebugging
value:
v2.0.50727

Now, the debugger can start, while the breakpoint is not active. Then, goes to
C:\Program Files (x86)\JetBrains\ReSharper\v6.1\Bin
open "JetBrains.ReSharper.TaskRunner.CLR4.exe.config"
change the <startup> section to below:

  <startup useLegacyV2RuntimeActivationPolicy="true">
    <requiredRuntime version="v2.0.50727" />
  </startup>

note: please make a copy of the .config file first.

Then, debugger and breakpoint work as expected.

It seems that VS2008 has some registry checking for the debugging extensions, not compatible with .net 4.0, and the external hosting process should also run with CLR 2.0 to successfully communicate with VS to support breakpoints.

Thursday, August 16, 2012

don’t call GdiShutdown when unloading dlls, an interesting matlab hang problem when closing.

I just fixed an interesting matlab hang problem for my colleague, who tested his image components with matlab, and always got hang problem when closing matlab, really a headache.

After analysing the dump, finding that matlab’s main thread is blocked at

   1: 00c2e1d8 4ecbcd7d 00000a38 ffffffff 00c2e2f0 kernel32!WaitForSingleObject+0x12
   2: 00c2e1f8 4ecbcd2c 4edd72bc 4ec7683a 00c2e4a8 GdiPlus!BackgroundThreadShutdown+0x47
   3: 00c2e200 4ec7683a 00c2e4a8 00c2e2f0 0dfd00de GdiPlus!InternalGdiplusShutdown+0x12
   4: 00c2e20c 0dfd00de 0c1355b6 00c2e3c4 00c2e4a8 GdiPlus!GdiplusShutdown+0x2c
   5: ...
   6: 00c2e4b4 7c91d0f4 0dfbcee2 0df50000 00000000 ntdll!LdrpCallInitRoutine+0x14
   7: 00c2e5ac 7c80ac97 0cdb0000 00000000 0c784a02 ntdll!LdrUnloadDll+0x41c
   8: 00c2e5c0 7bc2aa71 0cdb0000 00000000 0c78027f kernel32!FreeLibrary+0x3f

and the handle 0xa38 is a thread object, which is the background working thread of gdiplus.


   1: Handle 00000a38
   2:   Type             Thread
   3:   Attributes       0
   4:   GrantedAccess    0x1f03ff:
   5:          Delete,ReadControl,WriteDac,WriteOwner,Synch
   6:          Terminate,Suspend,Alert,GetContext,SetContext,SetInfo,QueryInfo,SetToken,Impersonate,DirectImpersonate
   7:   HandleCount      6
   8:   PointerCount     10
   9:   Name             <;none>
  10:   Object specific information
  11:     Thread Id   1f84.1e78
  12:     Priority    10
  13:     Base Priority 0

then further check the thread 1e78,


   1: 0e92fe7c 7c90df5a 7c919b23 000015c8 00000000 ntdll!KiFastSystemCallRet
   2: 0e92fe80 7c919b23 000015c8 00000000 00000000 ntdll!ZwWaitForSingleObject+0xc
   3: 0e92ff08 7c901046 0197e174 7c9138b0 7c97e174 ntdll!RtlpWaitForCriticalSection+0x132
   4: 0e92ff10 7c9138b0 7c97e174 00000000 7ff92000 ntdll!RtlEnterCriticalSection+0x46
   5: 0e92ff7c 7c80c136 00000000 00000011 00000000 ntdll!LdrShutdownThread+0x22
   6: 0e92ffb4 7c80b72e 00000001 00000000 00000011 kernel32!ExitThread+0x3e
   7: 0e92ffec 00000000 4ec67456 00000000 00000000 kernel32!BaseThreadStart+0x3c

The thread is trying to acquire the loader CS when calling ExitThread, which belongs to main thread since it is in the process of unloading dll. And the below shows the CS info, and the owner is the main thread.


   1: -----------------------------------------
   2: Critical section   = 0x7c97e174 (ntdll!LdrpLoaderLock+0x0)
   3: DebugInfo          = 0x7c97e1a0
   4: LOCKED
   5: LockCount          = 0x7
   6: OwningThread       = 0x00001ff4
   7: RecursionCount     = 0x1
   8: LockSemaphore      = 0x15C8
   9: SpinCount          = 0x00000000

Finally, the simple fix is to expose a function to call GdiShutDown in my colleague’s component, and matlab calls it explicitly before closing.

Make full use of parallel build in visual studio

I just got to know recently that visual studio supports parallel build of both multiple projects in one solution and multiple source files in each project via /MP(n) option. The former can be set in Tool-Option, and the latter can be found in project setting of VS2010, as show

http://blogs.msdn.com/b/visualstudio/archive/2010/03/08/tuning-c-build-parallelism-in-vs2010.aspx

As for VS2008, I have to manually specify it in the Project-Property-Compiling-Advanced page, “/MP8”.

Due to historic reason, our major product, consists some big projects which are bottlenecks, and fully rebuild is time consumingSad smile, generally you can hang out and enjoy your coffee with enough time. Since I joined the team, it is really a headache experience whenever I thought of rebuilding it. With the new option, the build process has been much faster.

While this option may conflict with existing codes, for our cases, like improper usage of precompiled header files, #import statements, and etc.

Thursday, July 19, 2012

A bug of JIT


Long time no update my blogSmile

Recently, one of our 32bit product experiences a weird crashing problem, the callstack shows crash happens during JITting a c# function. While if starting from debugger or disable JIT optimization from the config file, it works well.

After experiments, we isolated the specific statements causing the crashing problem:

   1: fixed(Point* pPoint = ...)
   2: {
   3:     ...
   4:     pPoint[index] = GetPoint();
   5:     ...
   6: }


The GetPoint is another c# function, returning a Point instance, which is a value type.


And just JITting the above codes with optimization enabled will cause troubles. And one work-around is to rewrite with a temp variable first, then assign with the temp var.


   1: Point thePoint = GetPoint();
   2: pPoints[index] = thePoint;


Though seems to be strange, it works well.


Sorry for not providing the callstack and debugging logs, since this happened one month ago, and I could not find detailed logs.


Some other things related to this interesting bug:


First, Obfuscator will remove the [MethodImplOptions.NoOptimization] attribute after obfuscating our assemblies, maybe there are some other settings, while finding the root reason is always the best solution than work-aroundsSmile


Second, the above exception thrown from JITting will be translated to first-chance ManagedException if attached with Visual Studio 2010, while show no CLR exception from windbg, maybe the CLR exception notification which is translated from JIT will not be sent to windbg.

Friday, March 16, 2012

VS2005 can also access .Net 3.5 libraries


Last week, one of SDKs built with VS2005 threw an exception from client’s hosting apps on their machines. Finally we found the reason – we call GC.WaitForFullGCComplete in our app, though the function was introduced in .Net 3.5, while since 2.0/3.5 share the same mscorlib.dll in the Framework 2.0’s dir, which is also updated by .Net 3.5 after VS2008 is installed. Then VS2005 can use the new functions without problem. Developers did not notice it. Then, if the client’s apps do not install .Net 3.5, the problem happens. So, we need to tell clients to install the 3.5 framework with latest service pack in the future.

This is kind of interesting, and the reason why we distributed the SDK built with VS2005 is that some of our clients have not upgraded to VS2008, and can not open our SDK’s samples if we only distribute VS2008 solutions and samples.

Friday, March 2, 2012

Why debugging in my visual studio 2008 is too slow?


Recently, I just realized that my visual studio 2008 is extremely slow during debugging one of our mixed-code products, a single step over will take a few seconds! What happens? The same product works well on my colleagues’ machine.

And today, one of my colleagues told me debugging on his machine also got slow down recently for another c# project. I checked his debugging setting, disable some options, and his problem disappeared.

Then, I tried them on my machine, a little improved, but still quite slow. After profiling the visual studio during debugging, finally found it tries to search some missing source code for each debugging command. Since I copied symbols for some 3rd party components sometime ago for troubleshooting one of the component bug, and leave them there. Then, when visual studio starts debugging, it will try to locate those missing source files for each debugging command, Why? Once fails, it should stop searching during the session until I manually start the search.

Then, I made a copy for those symbols of 3rd components until later they are needed, now, my studio works quite well.

Wednesday, February 22, 2012

A helpful post about always building c++ projects after being upgraded to VS2010

I also noticed that some of my c++ projects will always be compiled after upgrading my solution to VS2010. Just found this post (Fixing C++ projects that always rebuild) really helpful. It is said the problem is because of some missing header files in the project and MSBUILD rebuilds the project every time. The author also provide a simple sample to check the missing header file, will try with my case.

When CLR JIT meets floating overflow exceptions


Last year, one of my colleagues met a weird problem: the managed dlls he developed throw exception when integrated into one version of a CAD system --- MicroStation, while worked well for all other versions. The exception says about float overflow exception.

Then, after investigating the root reason, it is said that CLR JIT needs the floating overflow exception to be masked away, while this flag may be enabled by some applications, especially when developing some SDK in c#, integrating them into some old hosting application, and it may cause trouble.

The http://social.msdn.microsoft.com/Forums/en/clr/thread/b3505262-4e01-4e21-bea6-ce897caf4186 also talks about a similar case.

To fix the problem we can simple call

   1: _control87(MCW_EM, MCW_EM);

to mask away the related flags at the entry point of our SDK dll.

Who causes the failure of mt.exe during linking stage of Visual Studio 2010


Recently, I am working on migrating our products to Visual Studio 2010 from VS2008, involving both c++/c# and extensive interops, and found much more chances of linking failure, due to mt.exe failing to access the target exe.

We know that some guys think most of the cases are caused by anti-virus products, and when using VS2008, I also got a few failures, and some of them was caused by devenv.exe, instead of anti-virus, after analyzing the logs. Since not happening too often, I did not dig into that. Recently, too many times I have experiences, so, I tried to investigate it.

My investigation shows that the culprit is Resharper. When troubleshooting with procmon, it shows that before mt.exe fails to open the target, devenv.exe just owns it, and the callstack shows the Resharper is causing troubles, and the opening operation takes more than 2second. I doubt that previously VS2008 is also caused by Resharper. Just because it rarely happens, I did not investigate it further.

To disable Resharper, choose Tool-Option-Resharper-Suspend. After disabling it, the chances have been greatly reduced.

The callstack for my case is as below for your reference:

   1: Method instance: (BEGIN=0250fc90)(MD=06001353)[JetBrains.Util.CollectionUtil.ForEach[[System.__Canon, mscorlib]](System.Collections.Generic.IEnumerable`1, System.Action`1)]
   2: Method instance: (BEGIN=29bc5910)(MD=06001838)[JetBrains.ReSharper.Psi.Impl.Caches2.CacheUpdater.ExecuteMultiCore[[System.__Canon, mscorlib]](System.Collections.Generic.ICollection`1, System.String, System.Action`1)]
   3: Method instance: (BEGIN=29bc54c0)(MD=06001837)[JetBrains.ReSharper.Psi.Impl.Caches2.CacheUpdater.ExecuteMulticoreWithInterrupt[[System.__Canon, mscorlib]](System.Collections.Generic.ICollection`1, System.String, System.Action`1)]
   4: Method instance: (BEGIN=29bc4fd0)(MD=06001853)[JetBrains.ReSharper.Psi.Impl.Caches2.CacheUpdater+AddAssembliesJob.Do(JetBrains.Application.Progress.IProgressIndicator)]
   5: Method instance: (BEGIN=29bc3130)(MD=06001932)[JetBrains.ReSharper.Psi.Impl.Caches2.CacheUpdateThread.Run_ExecJob(JetBrains.ReSharper.Psi.Caches.Job, JetBrains.ReSharper.Psi.Impl.Caches2.CacheWorkItemSubprogress)]
   6: Method instance: (BEGIN=1a2b3480)(MD=06001931)[JetBrains.ReSharper.Psi.Impl.Caches2.CacheUpdateThread.Run()]
   7: Method instance: (BEGIN=1120f350)(MD=06000aeb)[JetBrains.Util.Logger.Catch(System.Action)]
   8: Method instance: (BEGIN=1a2b33d0)(MD=06001935)[JetBrains.ReSharper.Psi.Impl.Caches2.CacheUpdateThread.b__1()]

Tuesday, February 21, 2012

One possible solution about a c++ static object destruction problem


I just found an interesting post from http://www.missdeer.com/articles/1560 (sorry, a post written in Chinese, you can google-translate itSmile).

In the post, they had a problem in their products, when process enters _exit() call, the CLR cleanup codes calls into an global object which has been destroyed, and it crashes.

Though I don’t know what kind of situation they may have, but as far as I know, we can choose “#pragma init_seg()” family to control the global static object construction and destroy order. For instance, “#pragma init_seg(compiler)”  can guarantee objects defined in it will be constructed before any other objects, and destroyed after all others. Like cin and cout in CRT is implemented with that option.

The init_seg family also include:

#pragma init_seg(lib)

#pragma init_seg(user)

#pragma init_seg(“user defined segment”)

The construction order follows the above sequence, the compiler group constructs before lib group, which created before user group, and so on.

The destroy order is reverse to the construction.

Though have not tried their case, but may be the solution.

Assembly loading failure due to Zone.Identifier alternate file stream


Recently, one of my colleague sent some experimental SDK assemblies to internal developer in China, and found they could not be loaded at all. After collecting logs and the dump when the exception was thrown, finally found that it is due to the attached alternate file stream named as “Zone.Identifier”.

We know that the explorers like IE, Firefox will attach an Alternate File Stream to the downloaded dlls or documents, like CHM file will not be opened after downloaded until unlocked via file property dialog first, the same thing happens to CLR assemblies. So, after manually unlock the assembly, everything is ok then.

Friday, February 17, 2012

Find COM call’s target process/thread info


Last month, one of my colleague found his program just stuck in some out-of-proc COM call, but not knowing who is the target process/thread. After getting a dump, and try to apply the siepubext!comcalls, the output is:


   1: 0:000> !comcalls
   2:     Thread 0 - STA
   3: Target Process ID: 24b83444 = 616051780
   4: Target Thread  ID: 1591da22  (STA - Possible junk values)

Obviously unreasonable output. Since the extension has been too old, may not correct any more, we need to find another way.


The original callstack is:


   1: ChildEBP RetAddr  Args to Child              
   2: 0084f054 758e0bdd 00000002 0084f0a4 00000001 ntdll!NtWaitForMultipleObjects+0x15
   3: 0084f0f0 76c21a2c 0084f0a4 0084f118 00000000 KERNELBASE!WaitForMultipleObjectsEx+0x100
   4: 0084f138 76b3086a 00000002 fffde000 00000000 kernel32!WaitForMultipleObjectsExImplementation+0xe0
   5: 0084f18c 755d2bf1 00000048 0084f1d8 000003e8 user32!RealMsgWaitForMultipleObjectsEx+0x14d
   6: 0084f1b8 755d2d31 0084f1d8 000003e8 0084f1e8 ole32!CCliModalLoop::BlockFn+0xa1
   7: 0084f1e0 756ed2f6 ffffffff 19eab9d0 0ec2c48c ole32!ModalLoop+0x5b
   8: 0084f1fc 756ed098 00000000 0084f304 00000000 ole32!ThreadSendReceive+0x12d
   9: 0084f228 756ecef0 0084f2f0 0eca2670 0084f34c ole32!CRpcChannelBuffer::SwitchAptAndDispatchCall+0x1a7
  10: 0084f308 755d2cba 0eca2670 0084f434 0084f41c ole32!CRpcChannelBuffer::SendReceive2+0xef
  11: 0084f324 755e9aa1 0084f434 0084f41c 0eca2670 ole32!CCliModalLoop::SendReceive+0x1e
  12: 0084f3a0 755e9b24 0eca2670 0084f434 0084f41c ole32!CAptRpcChnl::SendReceive+0x73

The CRpcChannelBuffer:: SendReceiver2’s argument can be used to find the target process/thread info.


   1: 0:000>; dd 0eca2670
   2: 0eca2670  75607c08 755e92c0 00000003 0000000a
   3: 0eca2680  00000000 00000000 0027a960 0027c340
   4: 0eca2690  0ec2c488 0b4ede60 75606e70 00070005
   5: 0eca26a0  00000000 000024b8 00002c28 00000000
   6: 0eca26b0  75607c08 755e92c0 00000001 00000001
   7: 0eca26c0  00000000 00000000 0027a960 00000000
   8: 0eca26d0  00000000 0b4edf50 75606e70 00070005
   9: 0eca26e0  00000000 000024b8 00002c28 00000000
  10: 0:000>; dd 0027a960
  11: 0027a960  0ef674f0 0027a8e0 00003444 000024b8
  12: 0027a970  744021e9 eb1dc45b e6e85a30 79543058

The above “00003444 000024b8” are process ID and thread ID.